Plastic pallets dominate returnable asset fleets across logistics and are one of the most widely used returnable transport items (RTIs). Their scale – pallets carry about 80% of all world trade – creates operational dependence but also introduces management complexity that many organizations underestimate.
Plastic pallet fleets are treated as a fixed cost of doing business, and pallet optimization comes as an afterthought.
Plastic pallets are purchased in bulk, replenished when shortages appear, and written off periodically due to damage or loss. Productivity is typically inferred from high-level indicators like shipment volume, warehouse throughput, or inventory availability.
What rarely gets measured is whether the plastic pallet fleet itself is being used efficiently or if the capital invested in the pallets is generating enough returns.
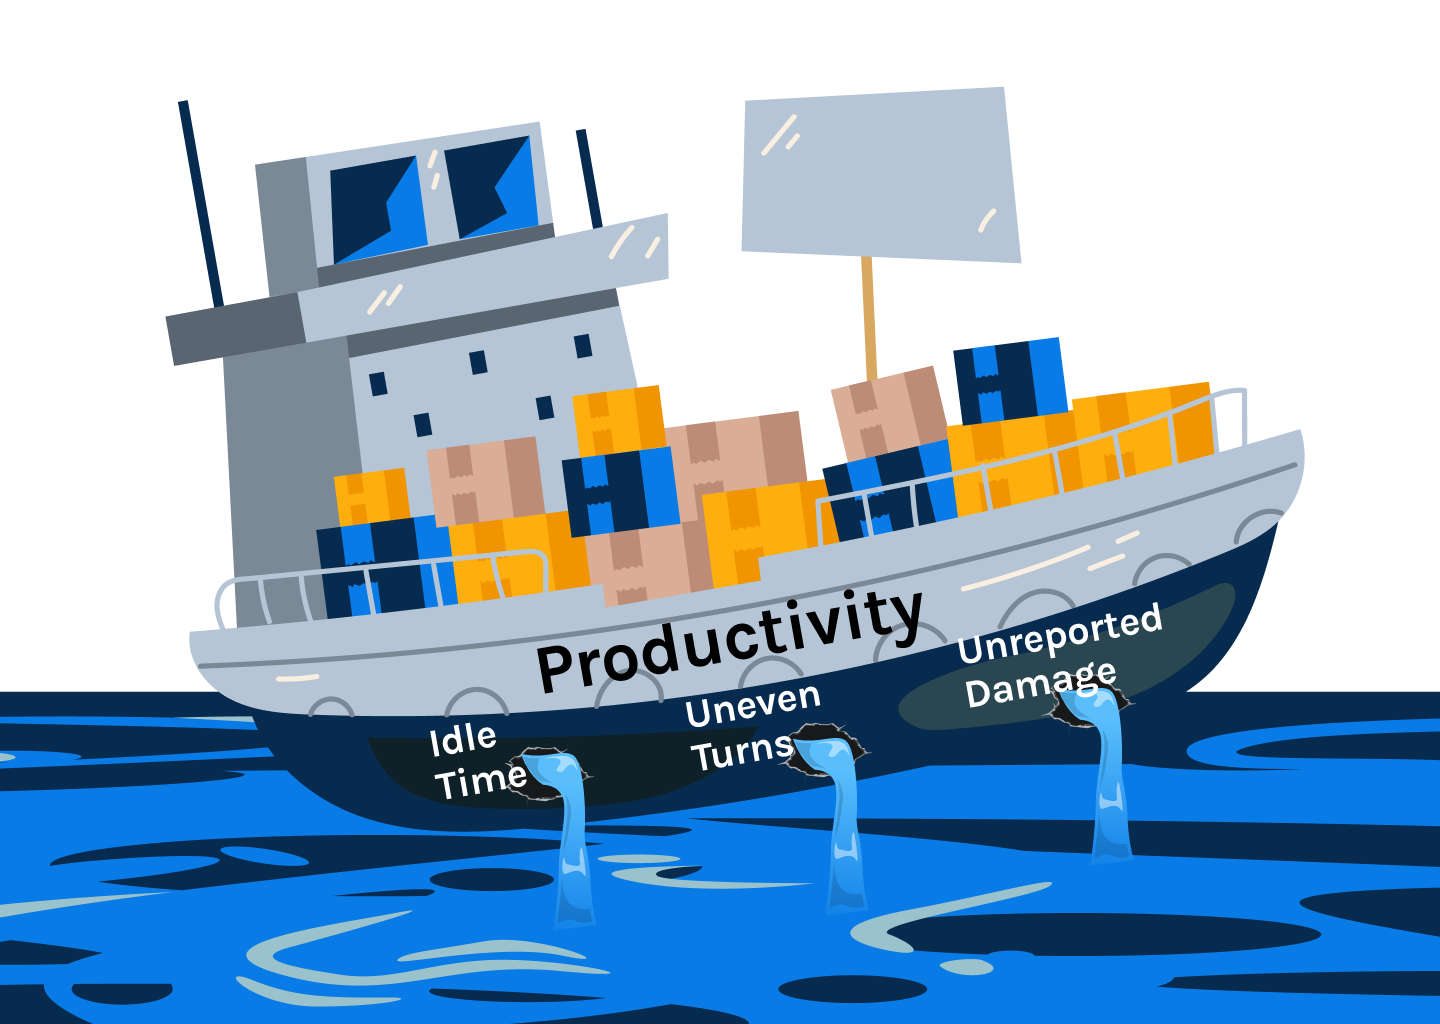
In practice, many fleets are not undersized or oversized in absolute terms. They are misallocated, unevenly rotated, and stuck in long dwell cycles across customer sites, yards, and reverse logistics loops.
Industry research on RTIs shows that pallets often remain idle far longer than expected, even when overall inventory levels appear sufficient, creating the illusion of low productivity while driving unnecessary replacement purchases and excess buffer stock.
The challenge compounds as networks grow more complex. Plastic pallets move through warehouses, yards, 3PL facilities, customer locations, and reverse logistics loops, each introducing delays and variability. A plastic pallet that appears productive on paper may spend weeks idle at a customer site or circulating through low-priority routes. Over time, these inefficiencies inflate fleet size, replacement costs, and operational friction.
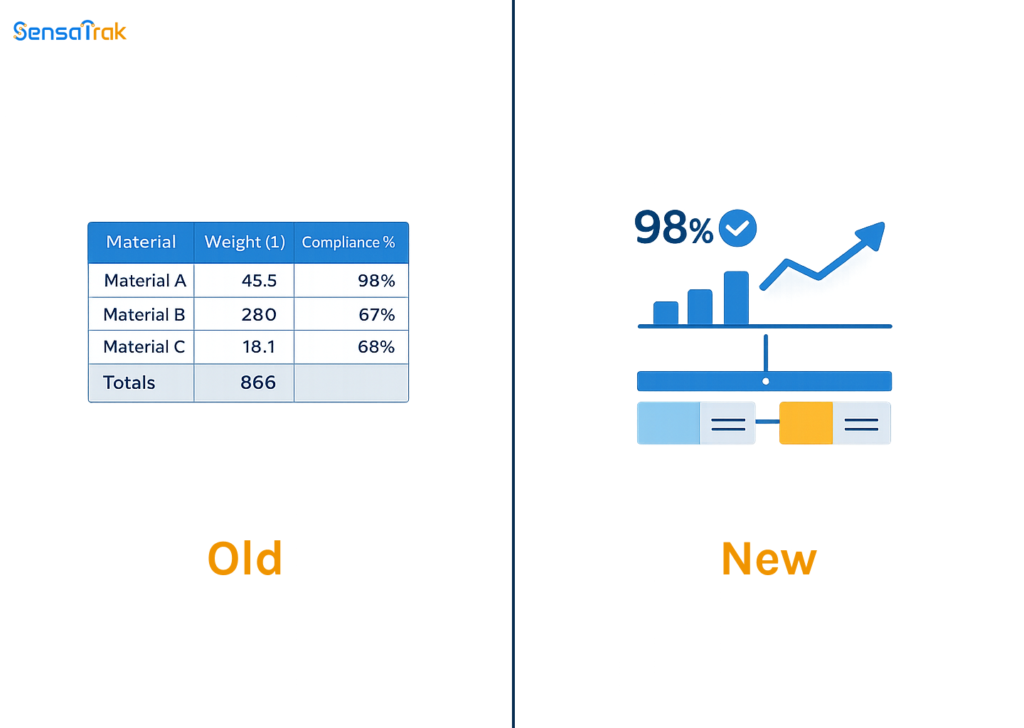
The problem is not the absence of data but the way productivity is calculated. Average plastic pallet turns, estimated cycle times, and static utilization ratios fail to capture what actually happens to individual plastic pallets once they leave a warehouse.
Studies consistently point out that productivity losses stem from poor visibility into dwell time, condition changes, and partner-handling behavior. What looks like a plastic pallet shortage is often an effect of these factors playing in the supply chains every day.
As logistics networks grow more distributed and customer expectations tighten, these blind spots become expensive. Without asset-level visibility and utilization insight, plastic pallets are prone to inefficient circulation, damages, and loss, reducing fleet productivity despite their longer designed lifespan.
This blog examines how logistics teams miscalculate plastic pallet fleet productivity, why traditional metrics fail, and how predictive analytics enables plastic pallet optimization by forecasting delays, identifying bottlenecks, and supporting data-driven fleet sizing decisions.
Where Logistics Teams Miscalculate Plastic Pallet Productivity
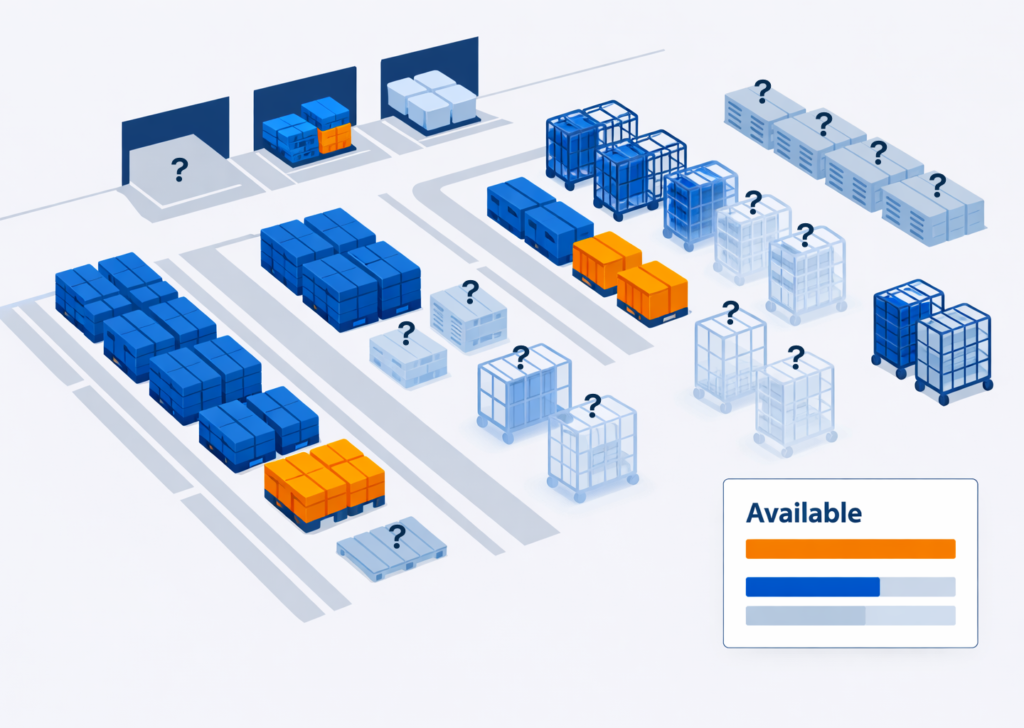
The most common mistake logistics teams make in plastic pallet optimization is equating availability with productivity.
If plastic pallets are visible in inventory systems or physically present across the network, they are assumed to be “working.” In reality, many of these plastic pallets are idle, sitting at customer sites, parked in yards, or stalled in return loops. Plastic pallets often remain embedded in downstream processes long after delivery, reducing circulation speed even though inventory counts, at the end of the financial year, appear healthy.
Another miscalculation stems from relying on averages. Average plastic pallet turns per year, or average cycle time, masks wide variations at the asset level.
Some plastic pallets may complete dozens of cycles annually, while others complete only a handful due to repeated delays, damage, or poor routing. When decisions are made on averages, these underperforming plastic pallets remain invisible, leading teams to believe the returnable asset fleet is underperforming as a whole rather than identifying specific bottlenecks or partner behaviors causing the drag.
Logistics teams also tend to underestimate the impact of dwell time across handoff points. Each transfer, like warehouse to carrier, carrier to customer, and customer to return hub, introduces delays. Without asset-level visibility, dwell times accumulate silently and are one of the primary reasons plastic pallet fleets appear undersized and trigger unnecessary replenishment.
Even with most logistics networks having shifted from wooden pallets to plastic pallets to improve durability, hygiene, and asset lifespan, this transition has not translated into higher fleet productivity.
The reason is simple: while the returnable asset has changed, the way it is measured has not. Most plastic pallet fleets are still managed using the bare-bones track-and-trace methods that capture isolated handoff events rather than continuous circulation behavior. Without end-to-end visibility across customer sites, yards, and return loops, plastic pallets suffer the same fate as wooden ones.
Finally, productivity is often measured without factoring in condition and usability. Damaged or partially degraded plastic pallets may remain in circulation, slowing operations or requiring rehandling, while others are prematurely scrapped due to a lack of repair visibility.
How Predictive Analytics Fixes Plastic Pallet Productivity Blind Spots
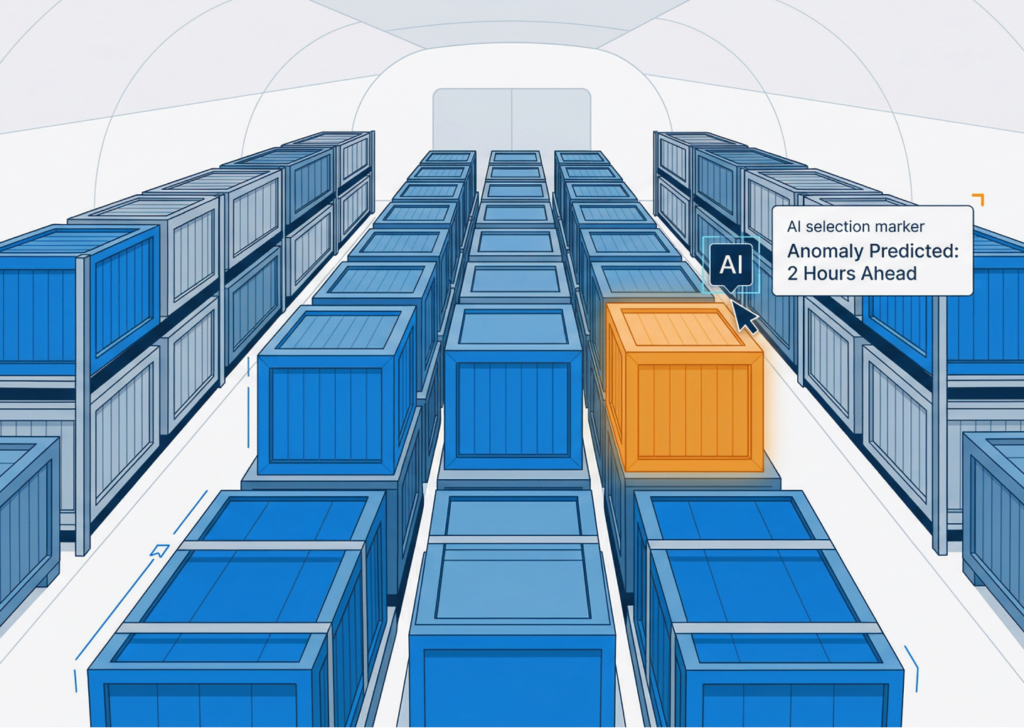
Predictive analytics shifts plastic pallet optimization from retrospective reporting to forward-looking control. Instead of asking how many plastic pallets were used last quarter, analytics models evaluate how individual plastic pallets behave across cycles: where dwell accumulates, which routes slow circulation, and which partner locations consistently delay returns. This moves productivity measurement from static averages to asset-level performance forecasting.
One of the most immediate gains comes from dwell-time prediction. By analyzing historical movement patterns, predictive models can identify plastic pallets that are likely to stall at specific customers, lanes, or facilities before delays compound. This allows logistics teams to intervene early, like rerouting assets, enforcing SLAs, or adjusting inventory placement rather than reacting after shortages surface.
Predictive analytics also enables cycle-time normalization. Instead of assuming a uniform return window for all plastic pallets, models establish realistic, lane- and partner-specific cycle benchmarks. Plastic pallets that deviate from expected behavior are flagged automatically, exposing underperforming segments of the network that average metrics conceal.
Condition-based forecasting further strengthens optimization. By correlating handling events, shock data, and usage frequency, predictive models estimate remaining usable life for plastic pallets. This prevents premature scrappage while reducing the circulation of degraded assets that slow operations.
Ultimately, predictive analytics transforms plastic pallet optimization into a control system. Instead of overinvesting in fleets to compensate for uncertainty, logistics teams can right-size inventory based on expected circulation, targeted interventions, and evidence-driven forecasts. The result is higher plastic pallet productivity, lower replacement spending, and a fleet that adapts dynamically to operational reality.
Operationalizing Predictive Analytics for Plastic Pallet Optimization

Predictive analytics delivers value only when it is embedded into operational workflows. For plastic pallet optimization, this means moving beyond dashboards and reports to actionable triggers that guide planning, execution, and partner management. For instance, analytics must inform decisions before shortages occur.
The first step is aligning predictive signals with operational thresholds. When dwell time exceeds expected limits at a customer site, yard, or return hub, the system should trigger interventions such as return reminders, rerouting decisions, or temporary redistribution of plastic pallets. These alerts replace manual follow-ups and enable teams to manage exceptions at scale without increasing headcount.
Next comes integration with planning systems. Predictive insights need to feed directly into WMS, TMS, and replenishment logic so plastic pallet availability reflects expected circulation. By forecasting when plastic pallets will realistically return to circulation, logistics teams can avoid unnecessary procurement while maintaining service levels. Plastic pallet optimization becomes a continuous balancing act driven by probability rather than assumptions.
Predictive analytics also supports returnable asset management throughout the entire supply chain. By aggregating dwell patterns, return delays, and condition events across customers and carriers, teams can identify systemic friction points in the network. This enables data-backed SLA enforcement, targeted process improvements, and informed contract negotiations.
Finally, operationalizing analytics requires governance and ownership. Clear accountability for monitoring predictions, responding to alerts, and refining models ensures the system improves over time. As conditions change, like seasonality, customer mix, and route structures, predictive models adapt, keeping plastic pallet optimization aligned with real operational behavior.
When predictive analytics is operationalized correctly, plastic pallet fleets stop being reactive buffers and become proactively managed returnable assets, closing the gap between visibility and control.
How SensaTrak Enables Sustainable Pallet Optimization
SensaTrak addresses plastic pallet productivity problems by treating plastic pallets as operational returnable assets instead of interchangeable inventory. The platform combines asset-level tracking with an observability-driven analytics layer that captures how each plastic pallet actually moves through warehouses, yards, customer sites, and return loops. This creates a continuous, verifiable record of circulation, dwell time, condition, and utilization across the entire network.
What differentiates SensaTrak is its ability to operationalize predictive analytics. Instead of static reports, the platform highlights plastic pallets likely to stall, routes where cycle time consistently degrades, and partners that introduce repeat delays. These insights integrate directly with WMS, TMS, and planning systems, allowing logistics teams to act before shortages occur. Plastic pallet optimization shifts from reactive replenishment to proactive circulation control.
SensaTrak also enables right-sizing returnable asset fleets at scale. By reconciling movement, availability, and condition data, teams gain an accurate picture of usable plastic pallet capacity at any point in time. This reduces overinvestment, lowers replacement spending, and extends plastic pallet lifespan, improving both cost efficiency and sustainability compliance without changing core operational workflows.
By combining tracking, analytics, and system integration into a single observability layer, SensaTrak gives logistics teams the control needed to make plastic pallet optimization measurable, repeatable, and resilient as networks grow more complex.