Sustainability reporting has moved from voluntary disclosure to regulatory expectation. Frameworks like the EU Corporate Sustainability Reporting Directive (CSRD) and the Greenhouse Gas (GHG) Protocol now demand a deeper, data-driven understanding of every environmental impact across operations.
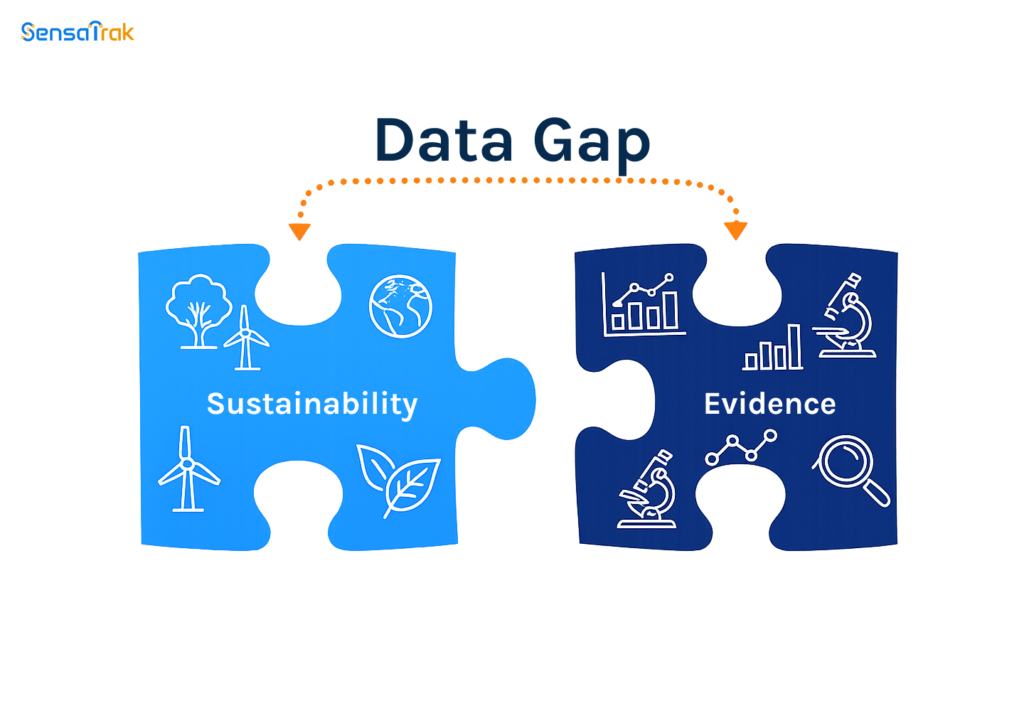
Yet, even as ESG reporting platforms evolve, most organizations still face a critical gap between intent and insight.
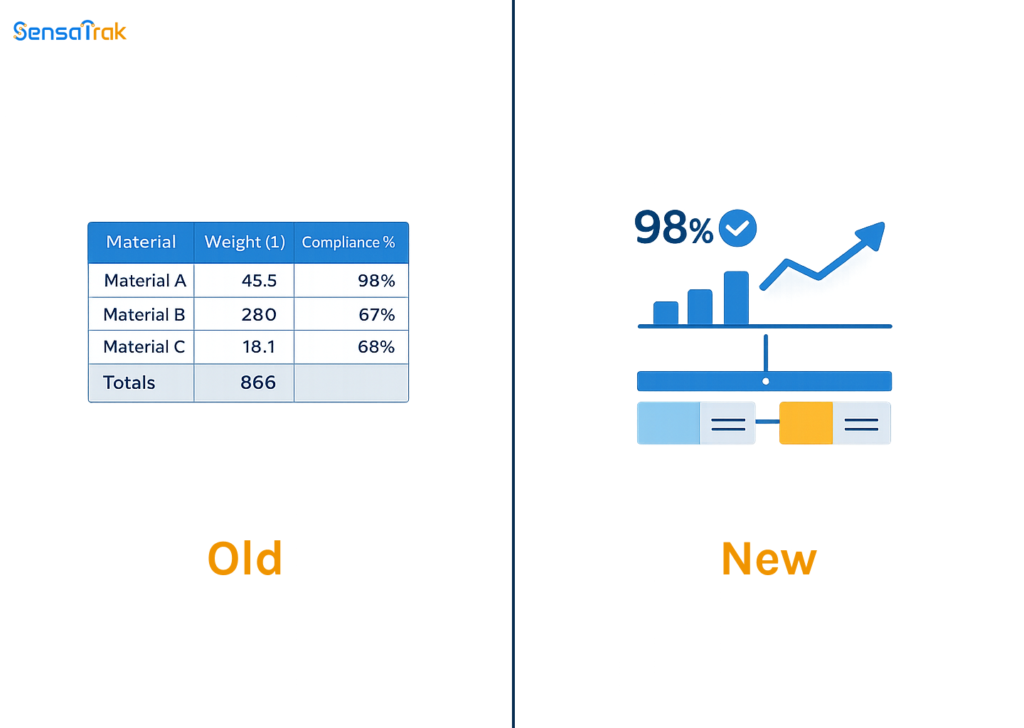
The real bottleneck isn’t the intent and implementation of the regulations and policies but more about the data, about what’s available, and what’s not.
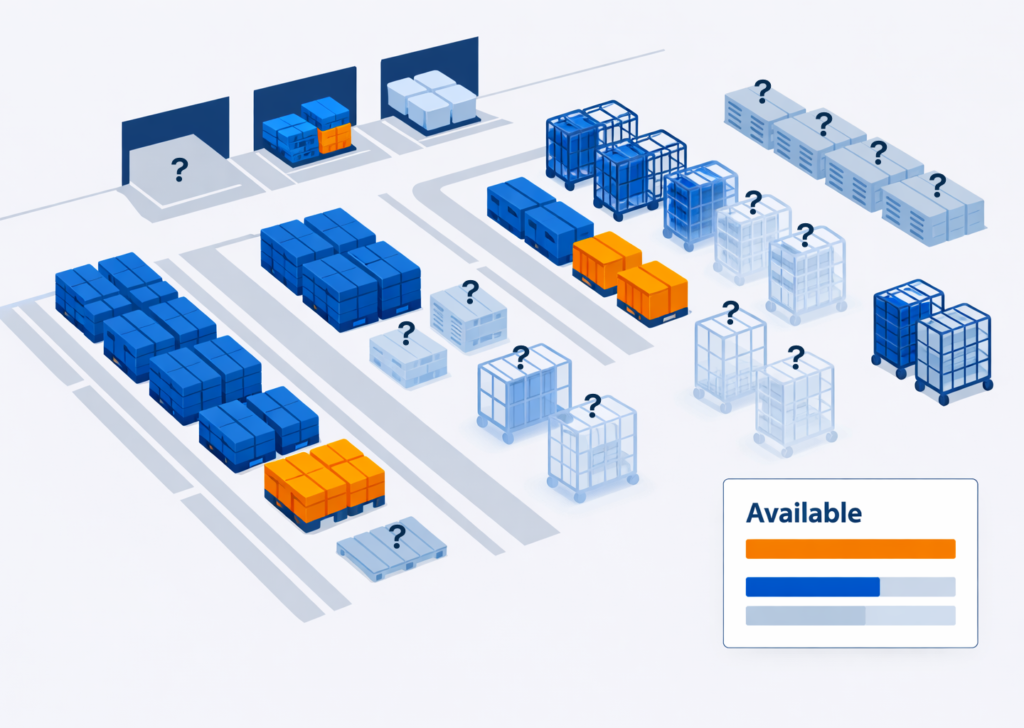
Across logistics, manufacturing, and distribution, the majority of sustainability reporting depends on aggregated or estimated information. Companies know their total fuel consumption or emissions but lack visibility into what’s happening at the asset level – how individual containers, pallets, or reusable transport items are being used, reused, or wasted across the network.
Various credible sources (1 and 2) confirm that supply-chain emissions and resource use cannot be measured reliably without granular, item-level data. Incomplete or averaged datasets create blind spots in Scope 3 reporting, masking inefficiencies that, if tracked at the asset level, could reveal substantial opportunities for waste reduction and reuse optimization.
In this blog, we’ll examine why asset-level visibility is the missing piece in sustainability reporting, what supply-chain data points matter most under today’s regulations, and how observability, digital tracking, and process alignment can make sustainability reporting both accurate and actionable.
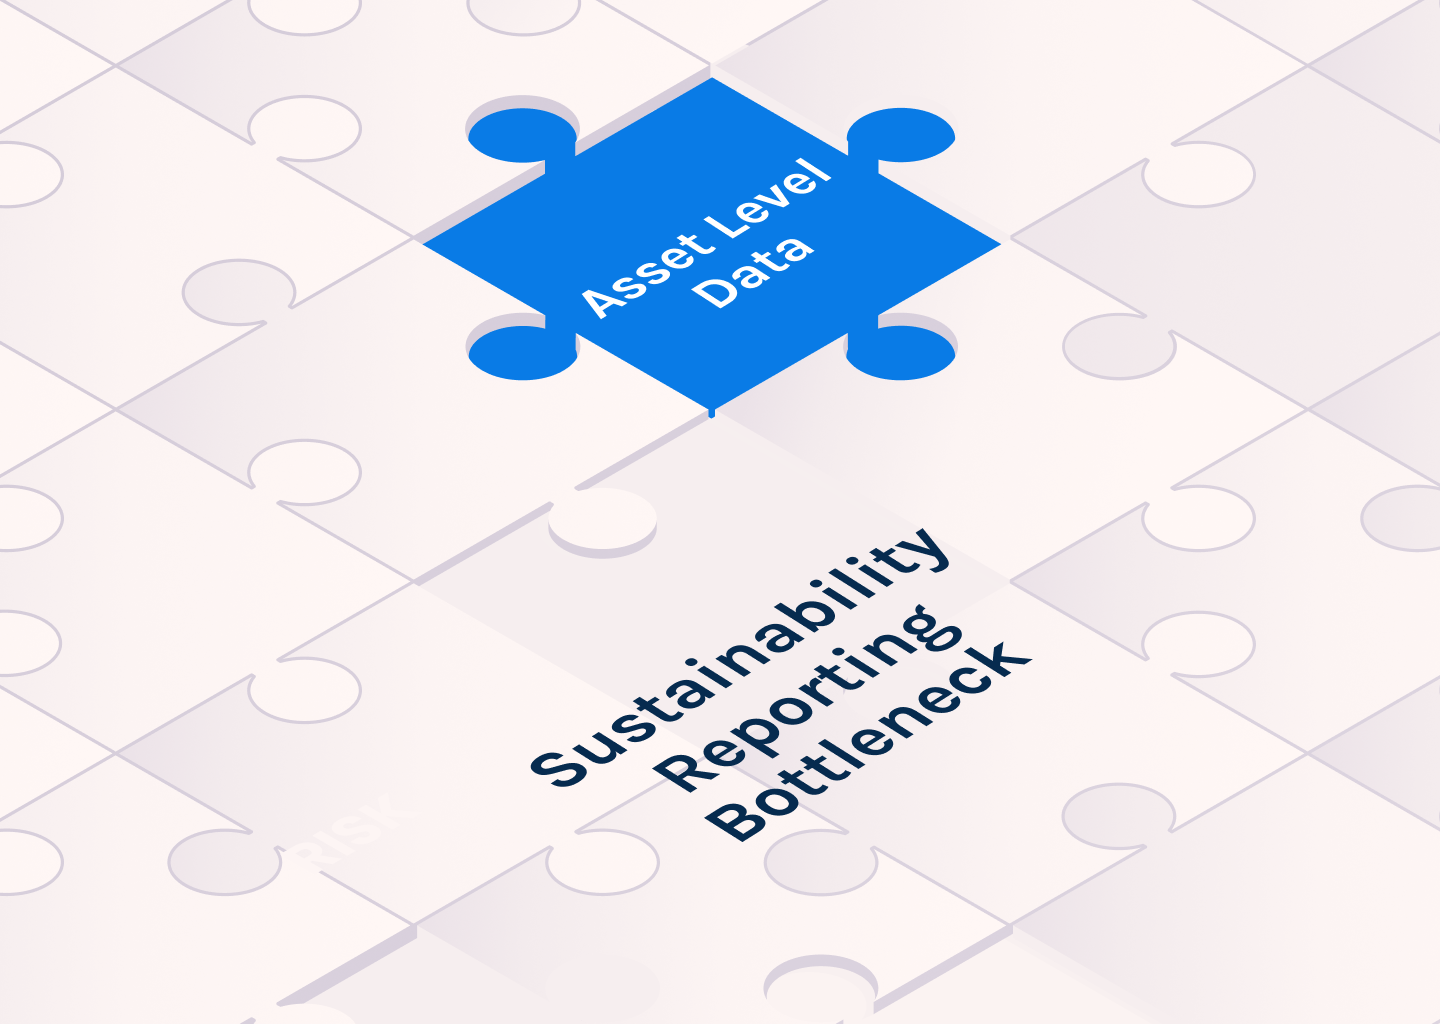
Why asset-level data is the missing link
Scope 3 compliance requirements cover upstream and downstream impacts you don’t directly control: materials extraction, component manufacturing, contract logistics, end-of-life, and more.
For sustainability reporting, you can’t credibly allocate those impacts with only spend-based or fleet-average factors. You need asset-level evidence that shows how returnable transport items (RTIs) actually move, how often they are reused, where they sit idle, when they are cleaned or repaired, and where they drop out of circulation.
Returnable transport items (RTIs) or returnable assets are deployed in volumes. If rotation is poor, you quietly increase the number of assets needed to service the same demand.
That raises embodied emissions per delivery cycle and adds avoidable moves, cleaning, and replacement. ESG reporting for returnable assets becomes guesswork if you can’t tie emissions and resource use to the real life of each pallet, crate, or roll cage.
What asset-level data unlocks.
- True utilization: cycles per asset, dwell by node, on-time return rates.
- Waste visibility: damage/loss ratios, exception causes (shock, temperature breaches), cleaning and rework load.
- Embodied vs. operational split: allocate manufacturing emissions across measured reuse counts, not assumed ones.
- Right-sizing the pool: prove how many RTIs you actually need when rotation improves.
- Audit trails: link each ESG figure to a verifiable asset history rather than a spreadsheet average.
With this, ESG reporting platforms can stop averaging and enable better & more compliant reporting – asset by asset, route by route, cycle by cycle.

What sustainability rules really require to be mapped
Most frameworks now expect decision-useful, traceable data. For logistics and RTIs, that translates into a short list of fields you should capture and report.
Core disclosure needs you can service with asset-level data
- Reuse & recovery: reuse counts per RTI, recovery rate, reasons for retirement; proof of refurbishment or recycling.
- Energy & resource per cycle: cleaning inputs, repair materials, transport energy allocated to the actual asset cycle.
- Waste & quality: spoilage due to temperature/shock, rejected loads tied to specific assets, avoidable rework.
- Material & circularity: material composition, reparability notes, parts replaced, recyclability pathways.
- Transport method data: mode, lanes, distances, load factors linked to the RTI cycles those shipments served.
How this aligns with common frameworks
- GHG Protocol Scope 3: use activity- and product-specific inputs where feasible; document methods and data lineage.
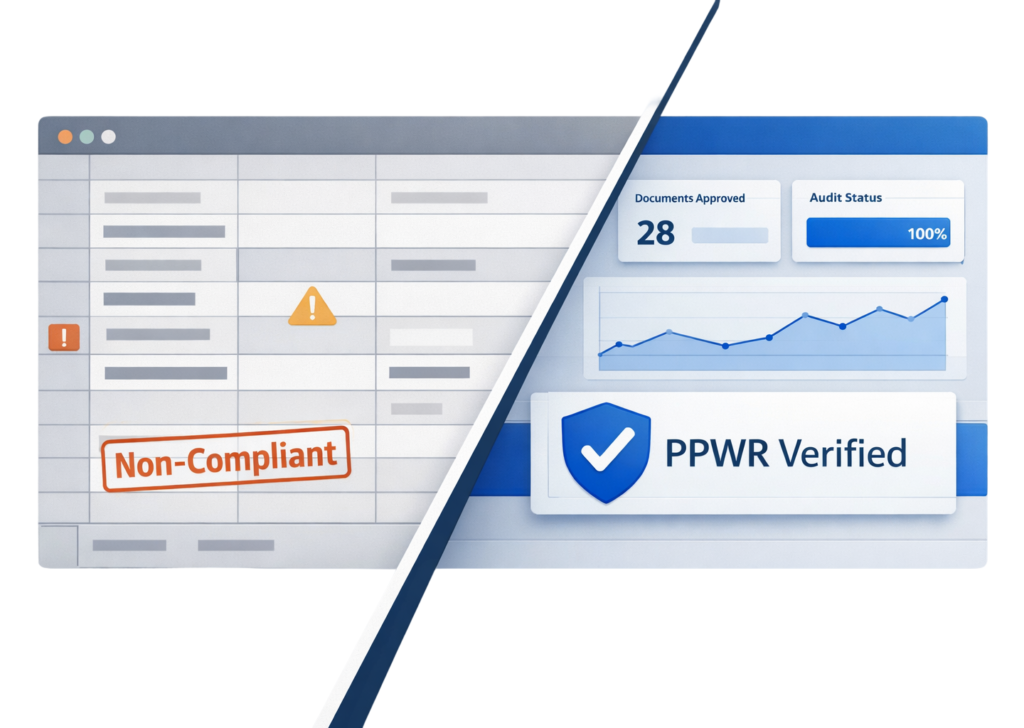
- CSRD / ESRS E1: provide disaggregated, traceable climate data that can be assured; show controls and data quality.
- ISO 14083 (transport): quantify logistics emissions using shipment parameters; allocate to RTI cycles with evidence.
Observability and AI: Turning Data into Compliance-Ready Insight
Sustainability reporting has to become much easier and seamless with the technology available with us. To do that, logistics teams need asset-level data they can trust, interpret, and defend.
That’s where observability and AI-driven analytics come together to make sense of millions of signals generated across RFID, BLE, GPS, and IoT systems.
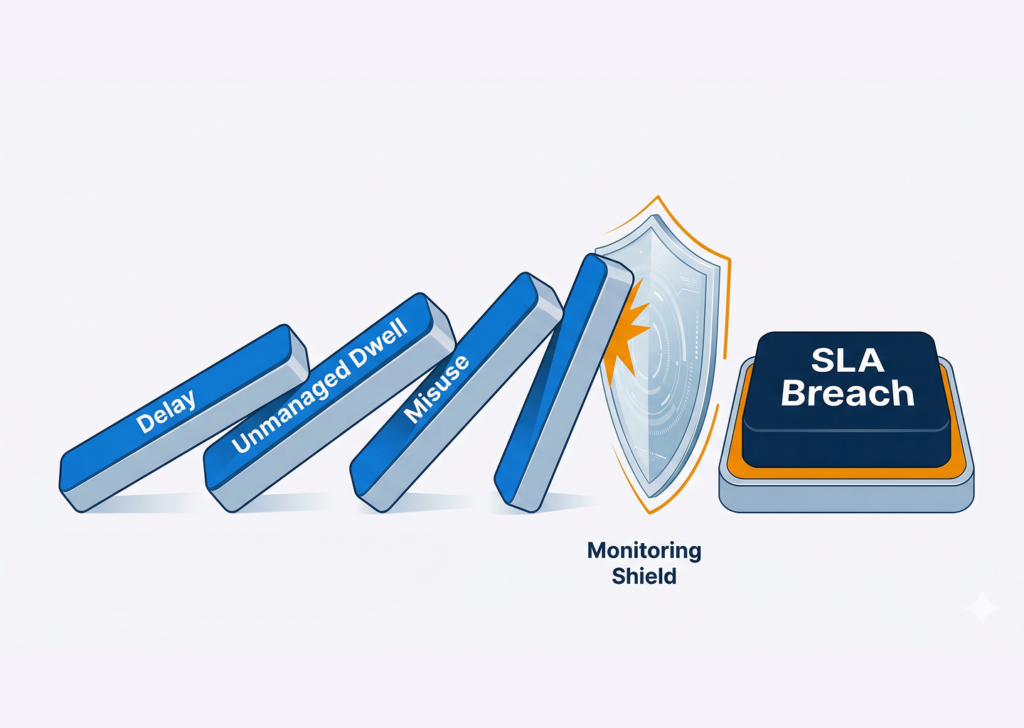
Observability ensures that every data point – a gate scan, a temperature log, a dwell alert – is connected to a single, verified asset identity. Instead of isolated readings, it builds a continuous trace of where each asset has been, how often it’s been used, and under what conditions.
This unified data model gives organizations the granularity required for ESG frameworks like CSRD and ISO 14083, where lifecycle visibility and traceability are non-negotiable.
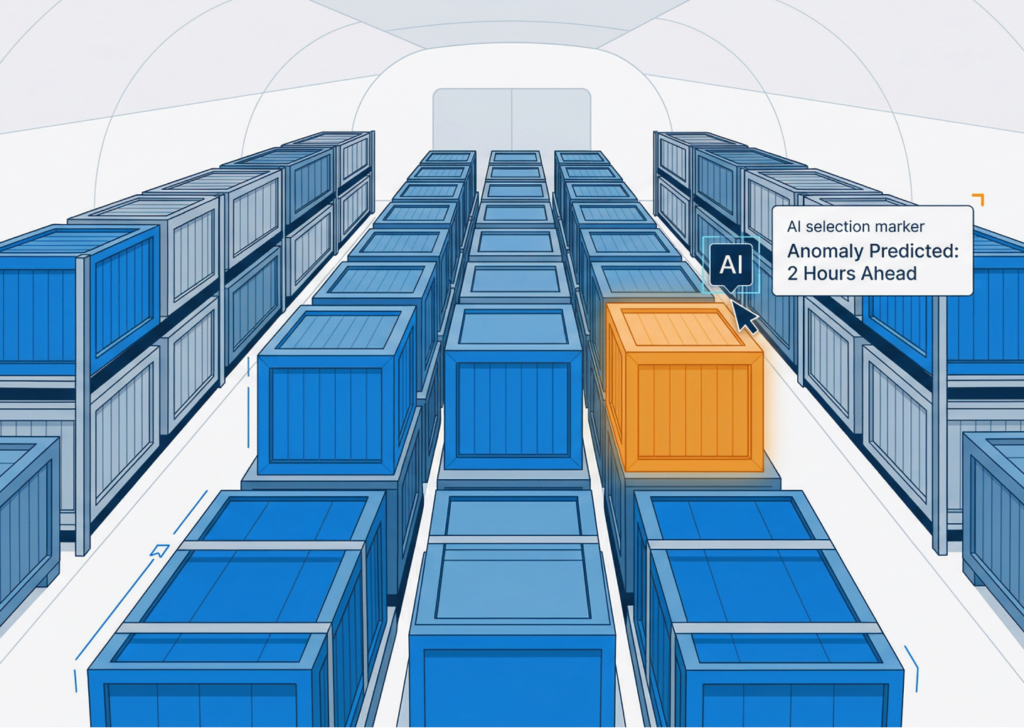
AI then takes this structured visibility further. By analyzing usage cycles, condition data, and route patterns, it identifies inefficiencies such as under-rotated assets, excessive dwell times, or temperature breaches that increase waste. These insights not only improve operations but directly strengthen sustainability reporting – helping teams quantify reuse rates, recovery efficiency, and emission reduction backed by verified data.
That’s exactly how SensaTrak is built. It doesn’t just collect tracking data – it contextualizes it through observability and interprets it through AI.
Every event, from a BLE zone ping to a GPS route update, feeds into a common analytics layer that delivers compliance-ready reporting automatically. Logistics and supply chain teams no longer have to reconcile data manually or depend on assumptions; the system already connects operational reality with reporting accuracy.
In essence, SensaTrak transforms raw asset signals into verifiable sustainability evidence – bridging the gap between movement data and measurable accountability.
Achieving Asset Level Data & Compliance Through Technology
Sustainability and compliance need to start with realizing what we don’t have, the missing gaps in data and insights. For logistics and supply chain teams, the proof of sustainability and being compliant lies in asset-level visibility that’s accurate, traceable, and audit-ready.
By combining observability, AI, and seamless tracking integration, SensaTrak helps organizations move from fragmented data to verified sustainability performance.
It ensures that every reusable asset contributes measurable value – to operations, to profitability, and to compliance.